Demonstration
Traffic Light Control (TLC) Demo
|
Without using TLC model Network average speed: 7.30 m/s |
Using TLC model Network average speed: 8.49 m/s Improvement : 16% |
Cut-in Behavior Model Demo
Platoon Control for Addressing Cut-ins Demo
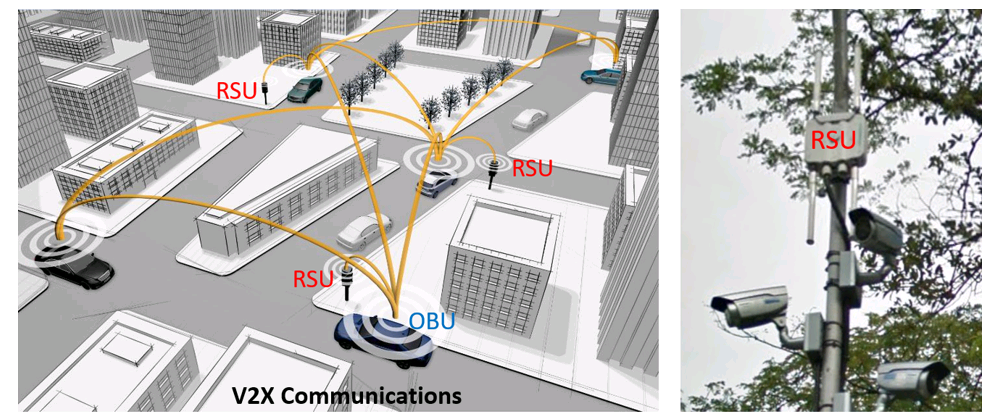
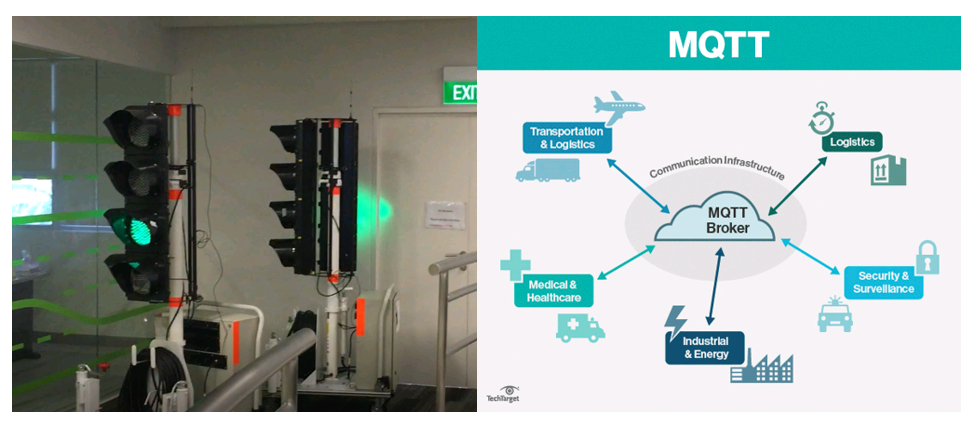
NTU-NXP Smart Mobility Testbed
 |
|
 |
|
Vehicle tracking by using V2X system
|
|
|
|
|
|
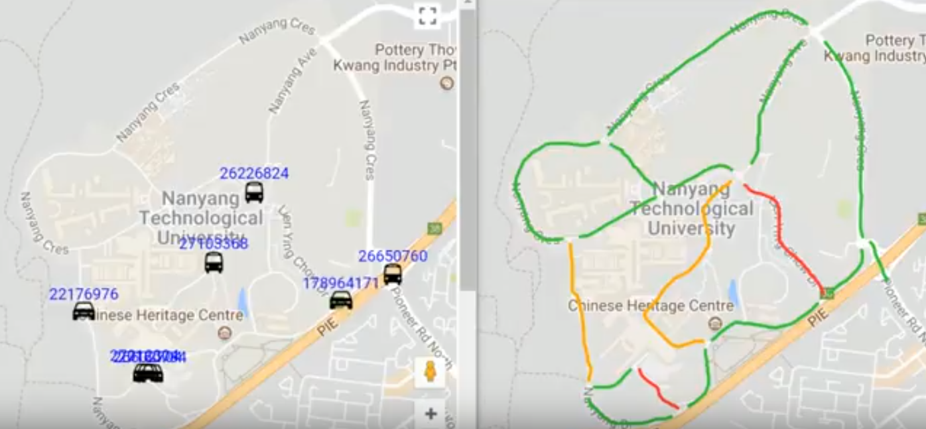
The video below demonstrated our vehicle tracking system, check the road/link number changes in the table (upper right corner) when vehicle changes road. Unique ID has been assigned for each road & link within NTU campus.
Data Collection & Analysing – Vehicle Activity Chart
 |
|
Data Collection & Analysing – Vehicle Position Heat Map
 |
|
Congestion Level Identification
 |
|
Simulations
Jurong Area Traffic System Simulation Platform Development in VISSIM
“Green Wave” Generation
Urban Traffic Network Closed-Loop Simulation
Route Suggestion - Show 3 Shortest (Time) Paths
|
Use Google Maps to display 3 shortest paths from position A to B.
|
Congestion Level Identification
Pedestrian Traffic Light Scheduling Using PTV Vissim + Viswalk
Bus (No. 179) Simulation Using PTV Vissim
Reference
Y. Zhang and R. Su. Pedestrian phase pattern investigation in a trafficlight scheduling problem for signalized network. 2018 IEEE Conference on Control Technology and Applications. Accepted. 2018.
Y. Zhang, R. Su and Y. Zhang. A macroscopic propagation model for bidirectional pedestrian flows on signalized crosswalks. 56th IEEE Conference on Decision and Control, pp. 6289-6294, 2017.
Y. Zhang, R. Su, Y. Zhang and C. Sun. “Modelling and Traffic Signal Control of Heterogeneous Traffic Systems.” arXiv, 2017.
Y. Zhang, R. Su, K. Gao and Y. Zhang. A pedestrian hopping model and traffic light scheduling for pedestrian-vehicle mixed-flow networks. arXiv, 2017.
Y. Zhang, R. Su, C. Sun and Y. Zhang. Modelling and traffic signal control of a heterogeneous traffic network with signalized and non-signalized intersections. 2017 IEEE Conference on Control Technology and Applications, pp. 1581 - 1586, 2017.
Y. Zhang, R. Su, K. Gao and Y. Zhang. Traffic Light Scheduling for Pedestrians and Vehicles. 2017 IEEE Conference on Control Technology and Applications, pp. 1593 - 1598, 2017.
A. Lentzakis, R. Su and C. Wen. Strategic learning approach to region-based dynamic route guidance. 12th IEEE International Conference on Control & Automation, pp. 842 - 847, 2016.
Y. Lu, L. Huang, J. Yao, R. Su. (2023). Intention prediction-based control for vehicle platoon to handle driver cut-in. IEEE Transactions on Intelligent Transportation Systems, vol. 24, no. 5, pp. 5489-5501
Y. Lu, B. Wang, L. Huang, N. Zhao, R. Su. (2022), Modeling of driver cut-in behavior towards a platoon. IEEE Transactions on Intelligent Transportation Systems, vol. 23, no. 12, pp. 24636-24648
Technology Disclosure (NTU Ref. 2023-347) Cycle-Based Network Adaptive Signal Control Method Using A Closed-Loop Online Updating Strategy. YAO Jiarong (CN); SU Rong (CA) filed on 25-Aug-23, Singapore provisional patent application number 10202303262U, filed on 17-Nov-2023. .